How to view Claude Code token usage
Per-turn token attribution across 7 categories — CLAUDE.md, skills, @-mentions, tool I/O, thinking, team overhead, and user text. Actual numbers, not the opaque progress bar.
The Claude Code terminal shows a three-segment progress bar for context usage — but no actual numbers. claude-devtools provides per-turn token attribution across 7 categories:
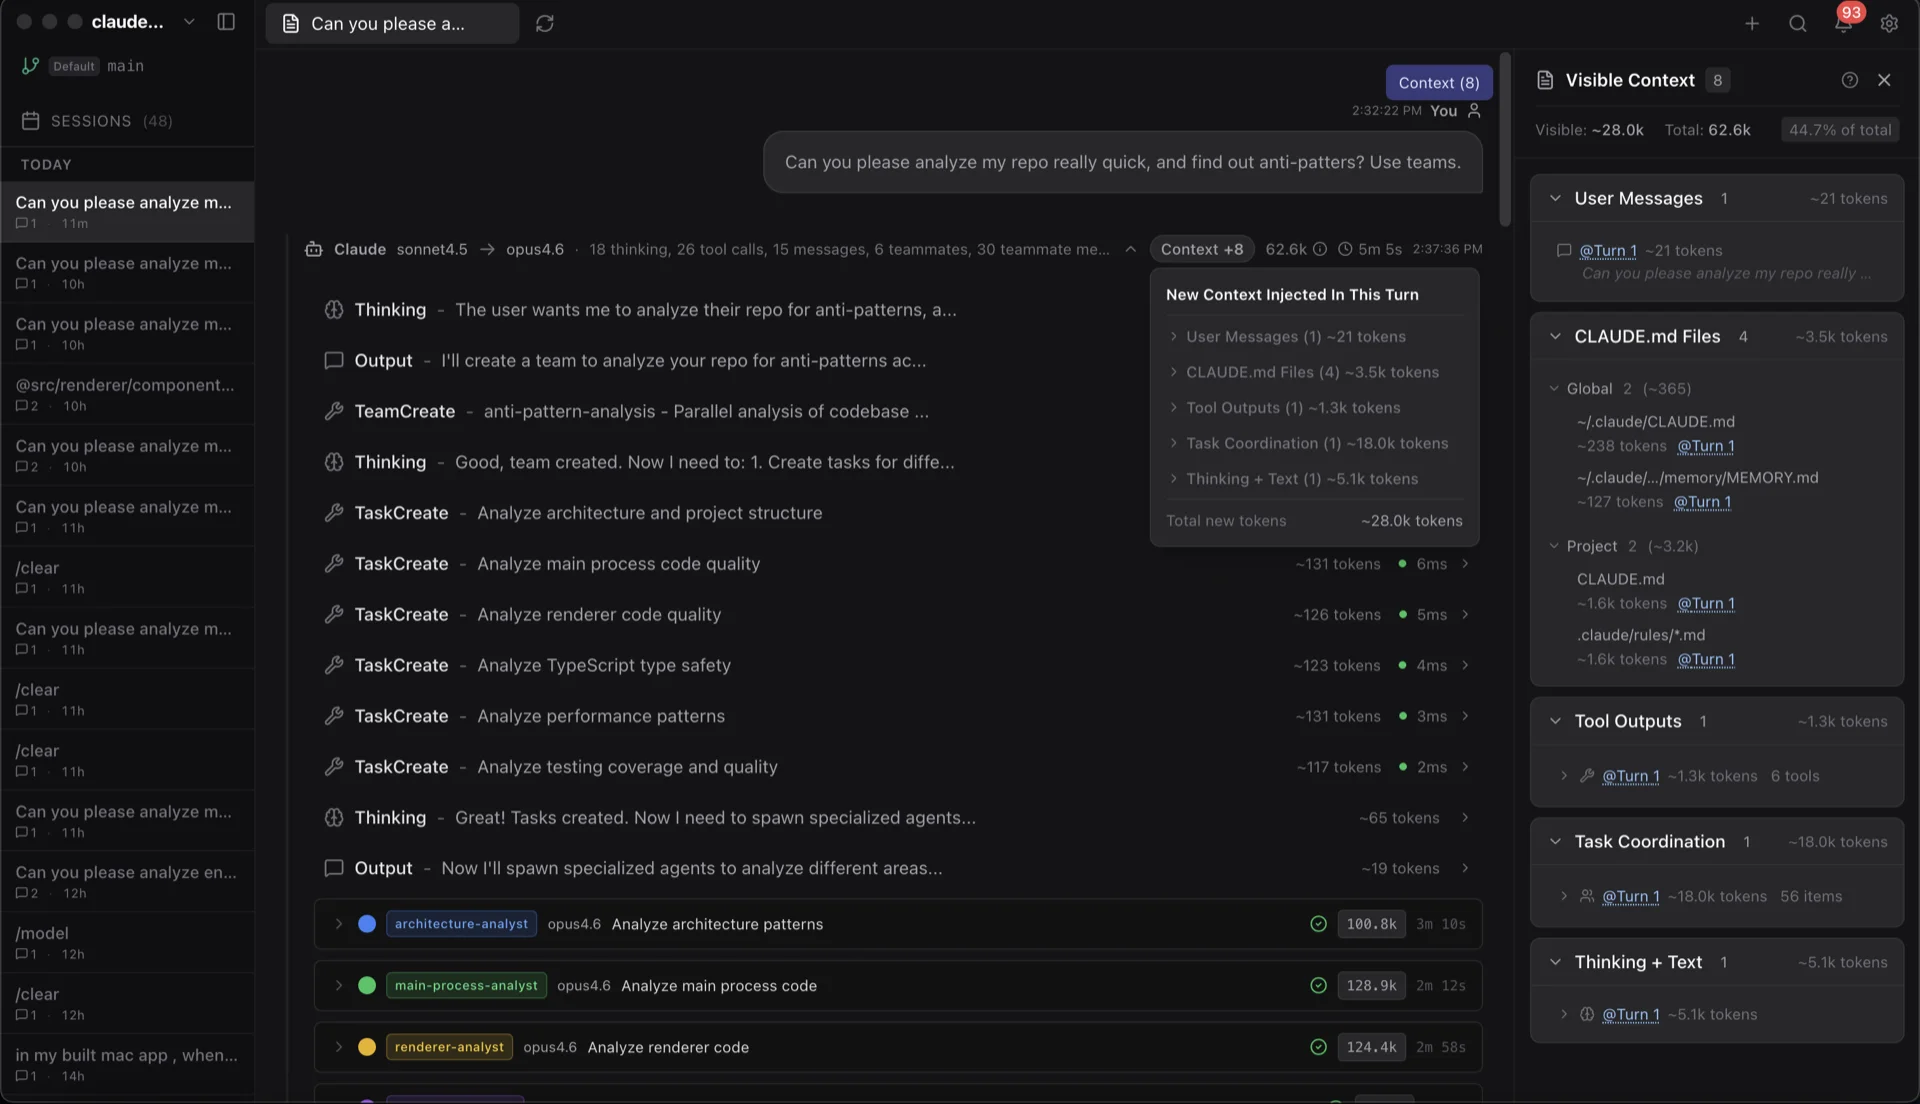
- CLAUDE.md files — global, project, and directory-level
- Skill activations — slash commands and custom skills
- @-mentioned files — files referenced in your prompt
- Tool call I/O — input and output tokens from Read, Edit, Bash, etc.
- Extended thinking — chain-of-thought tokens
- Team overhead — coordination tokens from subagents and teammates
- User text — your actual prompts
This breakdown appears as:
- A Context Badge on each assistant response — quick glance at where tokens went on that turn
- A Token Usage popover with percentage breakdowns and absolute numbers
- A dedicated Session Context Panel showing the running composition of the window over time
If a single category is dominating your context, this is how you find it. The most common surprises are CLAUDE.md files that grew too large, and tool I/O from Read calls on big files.
Related
How to debug Claude Code tool calls
Every tool call expanded — syntax-highlighted Read calls, inline Edit diffs, full Bash output, regex search matches, recursive subagent trees, and rendered Markdown / Mermaid.
Understanding Claude Code context window compaction
Claude Code silently compresses your conversation when context fills. claude-devtools shows the boundary, the token delta, and what was discarded — so you can see exactly what Claude no longer remembers.